

There are a lot of charts and graphs in the news with important information about wtf is happening right now. There’s the one showing stock market performance since January 20 (pointing down) and another tracking consumer confidence (also down). In the upward-trending category, we have the Federal Reserve’s inflation forecast, the percentage of Europeans who believe that Trump is a threat to peace, and the chances of serious outbreaks of deadly disease.1
But the biggest story of our lifetimes, the master narrative, the one graph that rules them all, is this one:
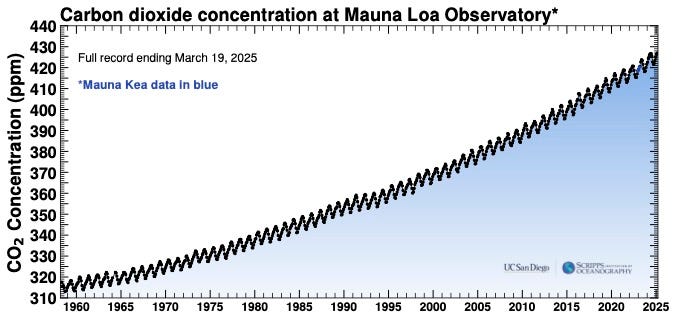
This is the Keeling Curve, the record of atmospheric CO2 from the Mauna Loa Observatory, starting in 1958. It’s named after its creator, Ralph Keeling, a climate scientist at the Scripps Institution of Oceanography in San Diego.
It’s a pretty famous graph, you’ve likely heard of it, or seen it. But since it just keeps doing the same thing, year after year—going up and up and up—it’s also kind of easy to ignore.
That is a mistake.
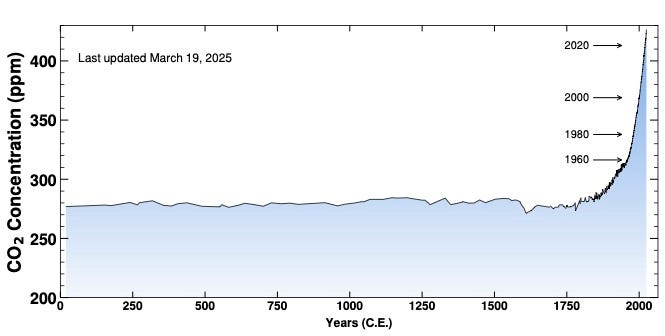
To understand why, we need to zoom out.
Here’s what the 67 years pictured above look like in the context of the last 2,000 years….
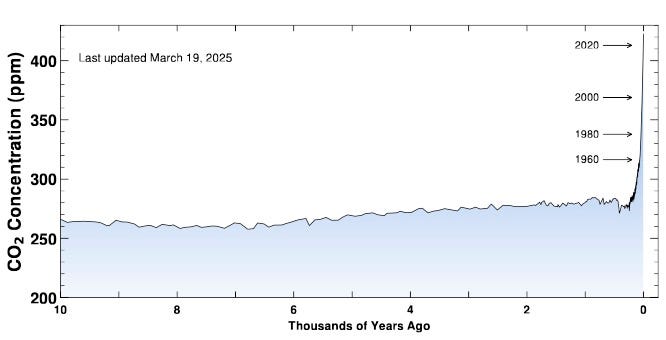
…and the last 10,000 years…
… and the last 800,000 years.
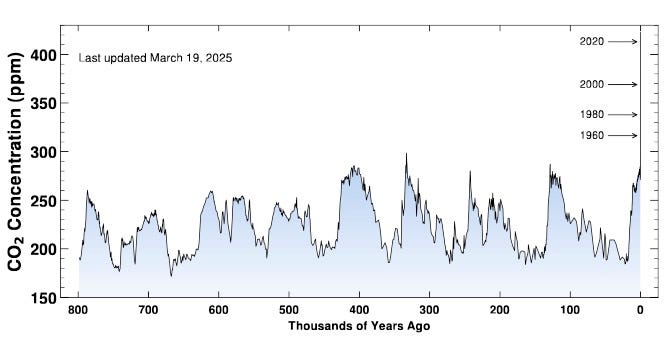
We are dramatically changing the chemical make-up of the atmosphere, and we’re doing it very, very quickly. As this last graph shows, current levels of carbon dioxide are far higher than they’ve been for the last 800,000 years. Higher atmospheric CO2 leads to higher temperatures. We are currently on track for a temperature increase of 3˚C2 by the end of this century, which would be catastrophic.
The Trump administration’s response to this is that there’s nothing to see here. They are seeking to overturn something called “the endangerment finding,” a recognition by the EPA that planet-warming emissions pose a threat to human health, which dates back to 2009. They’re also trying to hollow out the National Oceanic and Atmospheric Administration, where scientists keep track of carbon emissions and about a zillion other important things, including your daily weather forecast.
These attempts to deny climate realities are incredibly destructive. But they are also just flat-out absurd. Watching them calls to the emperor parading around in his underwear, telling everyone he’s looking great in his fancy clothes.
We know that radically and rapidly altering the systems that support life on our planet is dangerous. We also know how to lower emissions and reduce the suffering that will follow from overheating the planet. We’re just not doing those things.
If there’s someone in your life who believes what administration officials are saying about climate, here are some facts to share:
We now have much higher levels of carbon dioxide than anytime in the last 800,000 years.3
More CO2 in the air = higher average global temperatures.
The bulk of the CO2 increase has been in the last 100 years, which is extremely fast on the Earth’s timeline.
Faster rates of change make it harder for all living things, including humans, to adapt.
No amount of pretending these things aren’t real will make them less real.
No other story is more important.
See the 2024 Emissions Gap Report from the UN Environment Programme for details.
Carbon dioxide is not the only planet-warming gas that we’re emitting in record amounts, but I’m focusing only on CO2 in this post for simplicity’s sake.